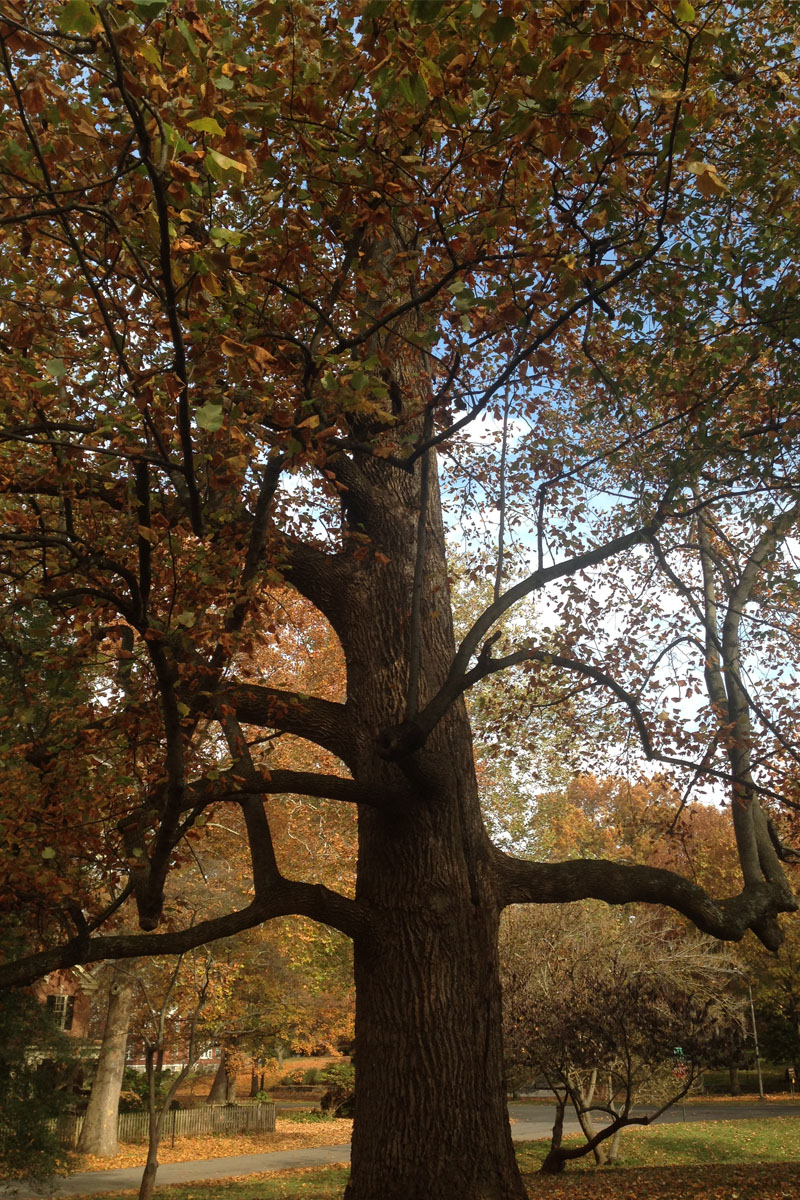
 A large tulip popular in the Ashland Neighborhood
Our Neighborhoods
This tree canopy study was conducted on several different neighborhoods within the area of New Circle road in Lexington, Kentucky.
The neighborhoods involved were:
- Ashland
- Ashland Park
- Aylesford
- Cardinal Valley
- Castlewood
- Columbia Heights
- Martin Luther King
- North Limestone
- Northside
The neighborhood with the most tree canopy per acre was Ashland Park, while the lowest counted tree canopy per acre was in the MLK Neighborhood. The tallest tree was located in the Ashland Neighborhood, a spruce or tulip poplar measuring, with lidar technology, at 114 feet tall.
Class Labs
This course used ArcGIS’ ArcMap as its primary map-making software. Our initial analysis of neighborhoods inside New Circle Road in Lexington Kentucky.
Lab 1. We created simple base maps of our neighborhood associations and measured the area of our neighborhood in different coordinate reference systems (CRS). We found that the Kentucky single-zone SPCS NAD 83 (EPSG: 3089) was the proper CRS for our study area.
Presentation
Lab 2.We used ArcGIS Raster calculator to create a Normalized Difference Vegetative Index (NDVI) using red and near-infrared bands found in the National Agricultural Imagery Program (NAIP). Using 2014 & 2016 imagery, we estimated tree canopy in each neighborhood based on vegetation density and compare it to the 2013 tree canopy study (sources below).
Presentation
Lab 3. We took to the field, using the smartphone application Avenza Maps to map POIs, or points of interests, completely subjective to the perspective of ourselves. We also pinpointed locations where our NDVI analyses did not register a tree, either completely or partly. We then mapped these POIs and NDVI-missed trees and posted our maps to our individual websites at: sweb.uky.edu/~username/nre355.
Presentation
Lab 4.We made an analysis and map using lidar elevation data and the NDVI vegetation density layer from Lab 4 to determine the height of all trees in our neighborhoods. We assumed that areas high vertical relief and vegetation density where trees. We then took to the field once more to find these predicted high trees and take pictures. These GPS points of tallest trees, their photos, and new canopy cover from picked NDVI were then mapped and added once again to our individual websites.
Presentation
Lab 5. We individually took the most pertinent data, tallest trees, and true canopy cover from Lab 4, POIs from Lab 3, zipped, or compressed, it and recreated it on an interactive map-making website CARTO maps, republishing this new map as the final addition to our webpages.
Presentation
Group project. We created this web page by assembling into teams that write the content, design the page in HTML, edit images, and make new maps as necessaery.
Data Sources
Neighborhood Association polygons, street centerlines, park polygons were downloaded from https://data.lexingtonky.gov/dataset, Lexington's Open Data Portal
Building footprint polygons were downloaded from http://www.openstreetmap.org © OpenStreetMap Contributors
Aerial photography raster dataset is from the National Agricultural Imagery Program (NAIP), 2016, 2014, and 2012 editions, and was downloaded from the REST web service at http://kyraster.ky.gov/arcgis/rest/services
Land cover raster dataset from the "Urban Tree Canopy Assessment and Planting Plan" created by the LFUCG and Davey Resource Group, October 2013, http://previous.lexingtonky.gov/Modules/ShowDocument.aspx@documentid=26521
Lidar data from Kentucky's Aerial Photography and Elevation Data program, 2013, http://kygeonet.ky.gov/kyfromabove
GPS points of interests from the students of NRE 355, fall 2017
Course credits
This website and content is collaborative effort between students.